Do you ever feel like you’re drowning in data and lack clarity about the direction in which you should move your patient support program forward? With Customer Relationship Management (CRM) systems as the norm, every interaction between your patient support program and your patients or providers should be tracked. It is incumbent to establish meaningful recommendations from this data to improve and direct your patient support program. But creating meaningful insights from data takes on a challenge that requires the right combination of technical skills, infrastructure, and knowledge of the patient support business.
In this blog, I’ll explore a few examples of how we at UBC leverage data to advance patient services programs.
Reducing Turnaround Time in Hub Lite Service Models
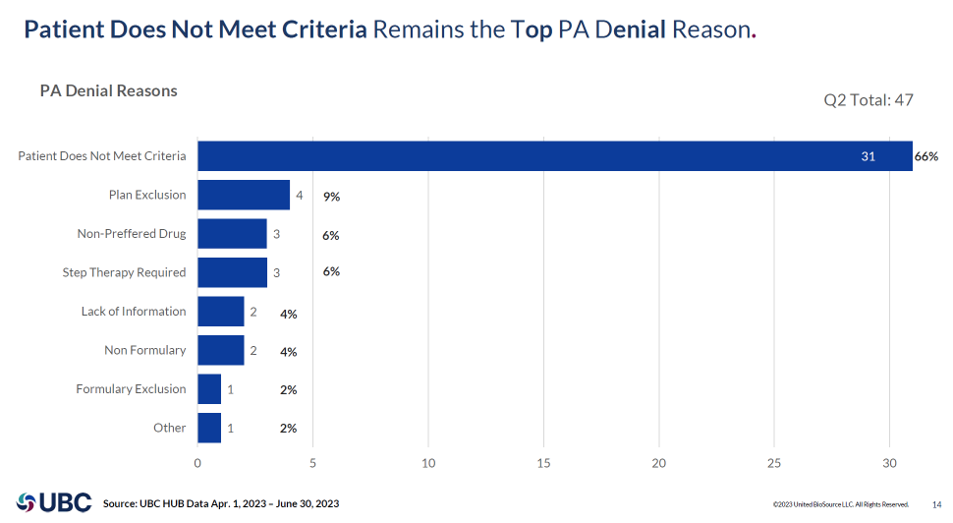
Our first example explores the nuances of program design for what is called “hub lite” vs. “full hub services”. We typically define hub lite as performing a quick benefits verification to determine if the patient has insurance coverage and if there is a required specialty pharmacy the patient must have their medication shipped from. In these models, the hub does not provide support for prior authorization or appeals, so this work is supported either by the specialty pharmacy or the electronic prior authorization (ePA) vendor. What we look for in these programs is data to help us understand the total time to first fill and where delays occur. We also want to understand the reasons why patients do not get approved for therapy. In the following example, UBC executed a program in a ‘hub-lite’ model where the ePA provider was completing the PA work. It was discovered that the top reason for denial was the patient not meeting criteria.
Additionally, we explored how patients were delayed in the process and found that prescribers submitting the required PA documentation were the top delay, averaging 3.6 days, whereas payers were only taking 1.5 days to make a determination. This data uncovered the design flaw that prescribers needed more information prior to initiating and submitting the prior authorization. We optimized HCP instruction to include a full listing of PA requirements as a part of the summary of benefits provided to the office, even though the PA support remained a part of the ePA vendors’ responsibility. As shown in the chart below, in the months following this change, UBC was able to reduce the total turnaround time (TAT) by 41%!

Increasing Adherence in Patient Education
Data can be used to explore the design of patient educational services as well. UBC has experience with many different programs where patient education may be offered by the pharmacies, non-clinical case managers, drug-specific trained clinicians, or even virtual assistants. The important data element to monitor for patient education is the engagement rate and adherence.
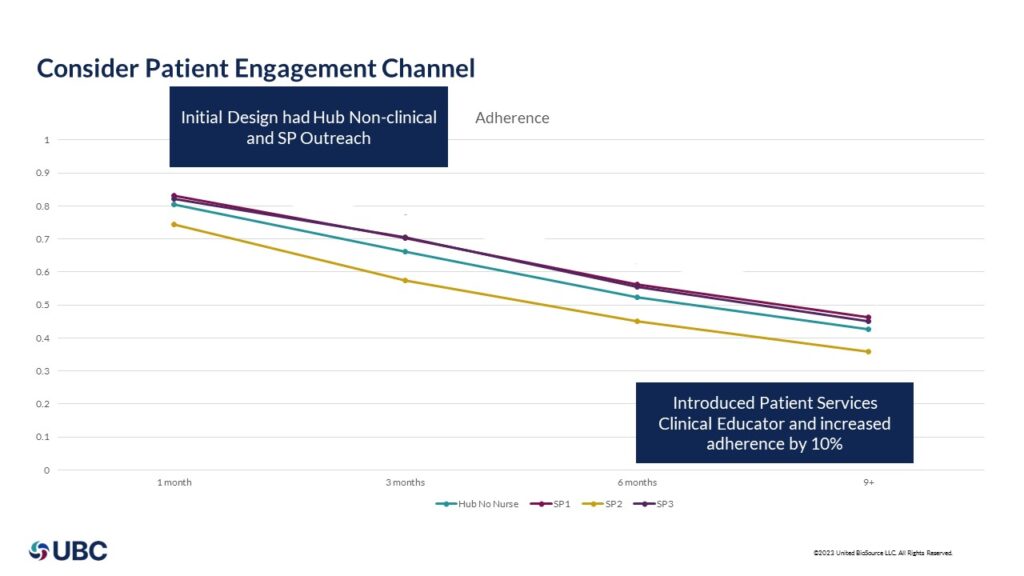
In this example, our client started the program with the specialty pharmacy providing the patient with education through the various specialty pharmacy education centers where nurses are a part of therapeutic centers of excellence. While the commercial pharmacies showed improvement in adherence, the difference between hub-provided non-clinical resources and specialty pharmacy-provided clinical resources was negligible. UBC and our client implemented a drug-specific patient services clinical educator program including a digital virtual assistant, which resulted in a 10% increase in patient adherence (see chart below).
Optimizing Patient Technology
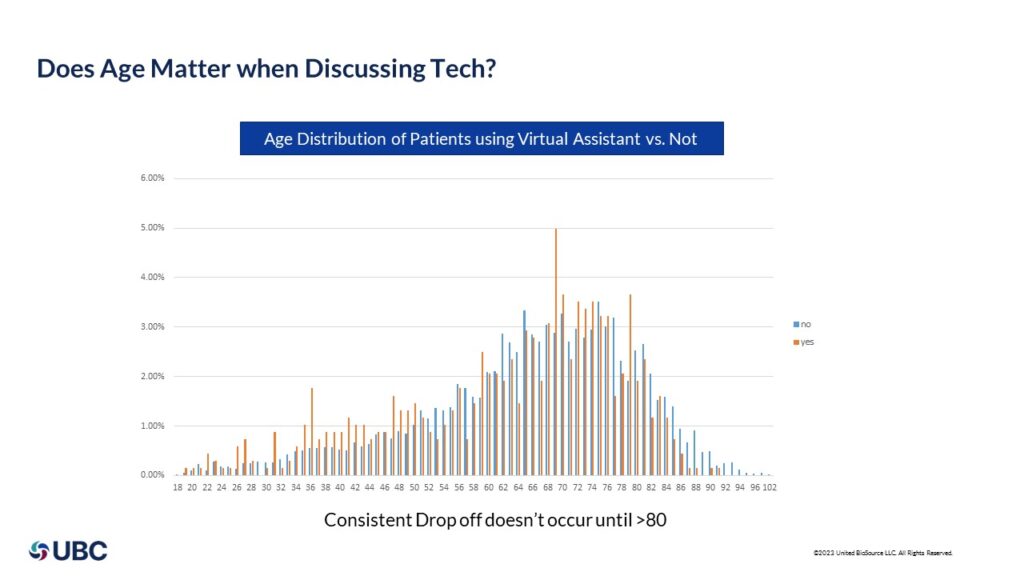
Reaching patients with the right technology is just as important. At UBC, we offer a virtual assistant to reinforce key messages and education. Many times, we are asked if Medicare patients respond to technology, so we analyzed our data to combine patient age with use rates of technology – specifically for the patient virtual assistant that is on their phone. We found that you can no longer state Medicare patients do not use technology – in fact, we don’t see a significant reduction in the use of technology until age 80.
Data Strategy: How To Make an Impact in Your Patient Services Program
So, what does it take to make this data come to life?
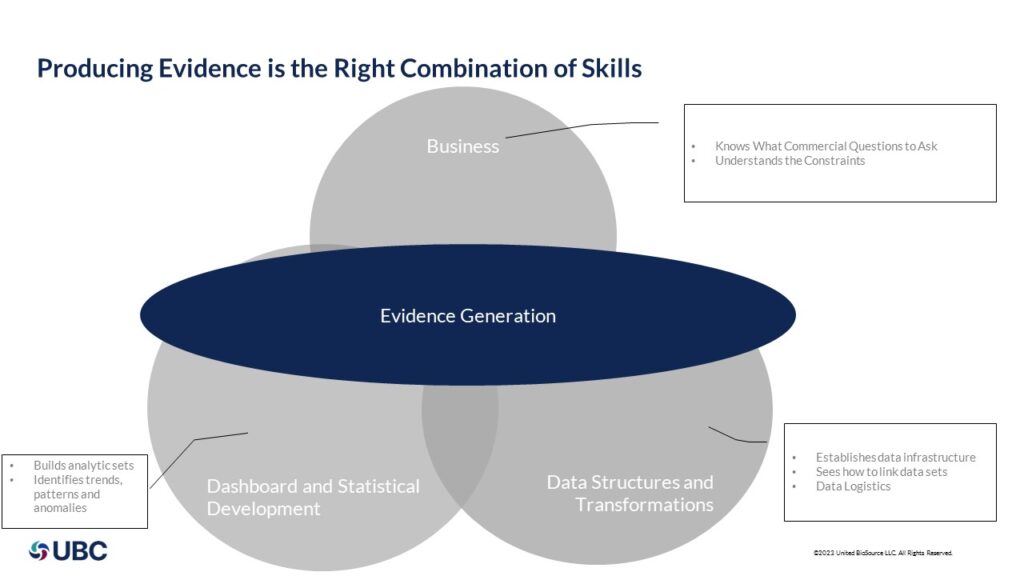
- Create a wide data substrate: if you do not have the ability to connect multiple data points – be it your hub, your ePA provider, external claims data, your specialty pharmacy, your copay card, your virtual assistant – you won’t be able to get a full view of the story.
- Have technical experts: having the technical expertise to create visual dashboards able to extract and link data is a requirement.
- Business analytics: knowing what questions to ask and how to mine the data for trends and insights is critical to creating recommendations. Many times, technical experts lack business acumen and/or business experts lack technical skills; therefore, it is key to find a partner that brings together this combination to produce evidence as shown below.
UBC creates patient-focused, technology-driven programs that are tailored to your unique therapy, prescriber, and patient needs. As an organization that is focused on uniting evidence and access, we have a strong ability to continuously evolve patient services based on powerful data insights. Learn more about our patient access services or get in touch with us here.
About the Author

Ron Lacy is the Vice President of Product & Innovation at UBC. With over 20 years of experience in technology and innovation in the healthcare technology space, he brings a wealth of experience covering everything from clinical research to patient access as well as PBM and Specialty Pharmacy. Ron holds a BS in Computer Engineering from the University of Illinois in Urbana-Champaign and a Masters of Business Administration from Washington University, Olin School of Business in St. Louis MO.


