


Compliance gets reported as a percentage, and sponsors treat it as a passing grade. A vendor quotes 95% submission compliance, and the conversation moves on. The number sounds strong in isolation.
It shouldn’t move on. On a program processing 100,000+ cases a year, 95% compliance means thousands of submissions that went out late, went out incomplete, or required remediation after the fact. The percentage hides the volume. A sponsor evaluating vendors on that single number is comparing headlines, not programs.
The gap between 95% and 99% isn’t a rounding error. It’s where regulatory exposure, remediation cost, and inspection risk live, and most vendor proposals don’t price it.
What’s Actually Hiding in the 4–5% Gap
Three categories of risk surface in this gap. None of them show up as a line item in a vendor proposal.
Regulatory submission risk. A late or incomplete individual case safety report (ICSR) isn’t an administrative miss. It’s a reportable event. FDA and EMA both track submission timeliness as a quality indicator, and a pattern of misses reads as an inspection signal, not a one-off. At 100,000+ cases a year, the difference between 95% and 99% compliance is the difference between roughly 5,000 non-compliant submissions and fewer than 1,000. That’s not a statistical footnote. That’s thousands of cases a sponsor must explain if a health authority asks.
Inspection exposure. Regulators inspect systems, not spreadsheets. A reviewer looking at a program with a documented 5% miss rate is looking at a systemic gap, not an outlier they can wave off. The programs that hold up under inspection are the ones where the compliance rate was never close to the threshold in the first place.
Remediation and reprocessing cost. Errors in the 4–5% don’t disappear once the submission window closes. They generate reprocessing work, sometimes regulatory notifications, occasionally a retrospective audit. That cost lands on the sponsor’s team, not the vendor’s monthly invoice. Few sponsors calculate what a single remediation cycle actually costs in internal staff time, regulatory affairs hours, and delay to an active program. It’s worth doing that math before signing, not after.
Why the Gap Persists
Part of the reason this gap survives vendor selection is how compliance gets measured and reported in the first place. Figures are usually presented as program-level averages, and an average can mask a lot. A vendor can post 95% overall while running closer to 80% in the most complex case types, the ones most likely to draw regulatory attention.
Sponsors rarely have the visibility to challenge the number as presented. Vendor contracts don’t always specify how the compliance rate is calculated, what falls inside the denominator, or whether submissions delayed by the sponsor’s own data quality issues count against the vendor’s score. A contract that only specifies an SLA percentage, without defining the calculation methodology and the consequence for sustained underperformance, isn’t giving the sponsor much to hold the vendor to.
What Holding a Higher Standard Looks Like in Practice
The answer isn’t a different claim about compliance. It’s a compliance rate that’s been validated externally, at volume, over time.
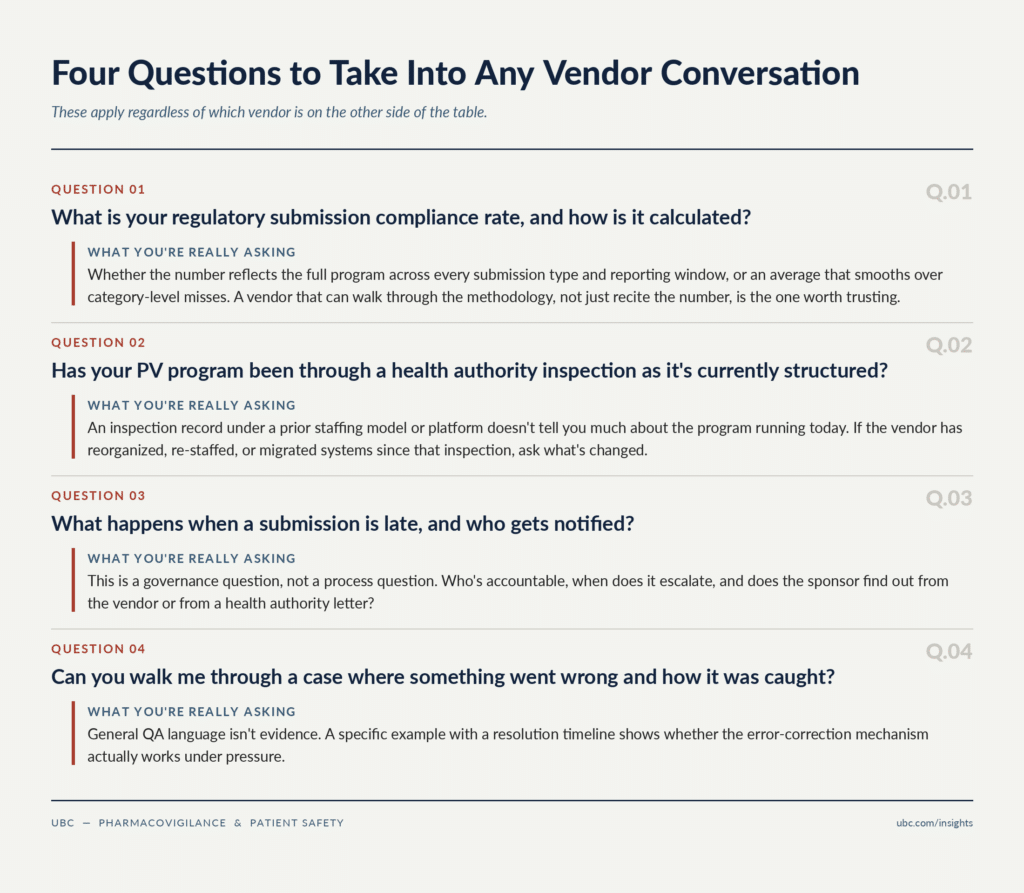
UBC processes 70,000+ cases annually and sustains greater than 99% on-time regulatory submission compliance against that volume, the denominator that makes the percentage mean something. That track record has held across 30 regulatory inspections with no critical findings. And because UBC operates a full-service outsourcing model, accountability for the program sits with UBC, not with a staffing layer inside a sponsor-managed system. That answers the governance question in the checklist above directly.
The Number That Matters
The compliance standard that matters isn’t the one printed in a vendor’s pitch deck. It’s the one that holds up under a health authority inspection, at full program volume, year after year.
The four questions above apply to any vendor evaluation, including UBC. They’re the right questions regardless of who’s answering them, and a vendor confident in its compliance record won’t hesitate to answer.
If you want to talk through how UBC structures its client PV systems and what that ideal standard should look like for yours, we welcome that conversation with you.
About UBC
United BioSource LLC (UBC) is the leading provider of evidence development solutions with expertise in uniting evidence and access. UBC helps biopharma mitigate risk, address product hurdles, and demonstrate safety, efficacy, and value under real-world conditions. UBC leads the market in providing integrated, comprehensive clinical, safety, and commercialization services and is uniquely positioned to seamlessly integrate best-in-class services throughout the lifecycle of a product.
About the Author

Tom Coles, Director, Pharmacovigilance
Tom Coles, Director, Pharmacovigilance, has over 10 years’ experience in the pharmacovigilance industry, Tom has overseen case processing teams in pharma and CRO settings, managed client PV systems and projects, authored aggregate reports across multiple indications, serves as the product expert for signal risk management and represented PV for business development activities. Tom is specialized in helping Chinese pharma companies enter the global market, ensuring their PV Systems are fit-for-purpose. At UBC, Tom is part of the PV leadership team and leads the Process Excellence function which manages and maintains client PSMFs, as well as the coordination of PV process documents, compliance, regulatory intelligence, and safety incident reports.