

The world of pharmacovigilance has long grappled with the complexities of operational oversight, traditionally extracting, deriving and synthesizing data about the pharmacovigilance workflow from databases designed for managing product safety data. However, a significant transformation in pharmacovigilance oversight is now underway, driven by the emergence of more sophisticated platforms for operational data analytics.
As discussed in the blog “Operational Data On Demand”, solutions such as UBC’s Tableau Data Analytics platform help overcome conventional barriers to pharmacovigilance oversight by offering a platform that centralizes all operational pharmacovigilance data, offers real-time access to that data, customizes visual dashboards to the needs and specifications of particular pharmacovigilance programs and personalizes data analytics to diverse users and their objectives.
Once pharmacovigilance programs have access to real-time oversight data, the applications are diverse and dynamic. Internally, this oversight data can be used to improve the pharmacovigilance process by proactively detecting and addressing potential issues with resource distribution, quality control, program oversight into key performance metrics, and regulatory compliance. Externally, oversight serves to strengthen trust between stakeholders and streamline communication for better organizational decision-making.
Proactive forecasting improves regulatory compliance
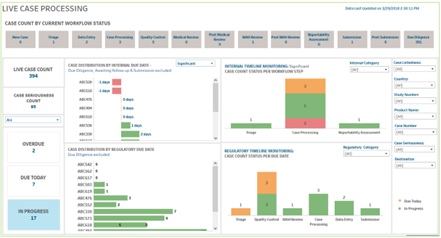
A Live Case Processing dashboard helps pharmacovigilance staff efficiently prioritize the review of cases approaching their review deadlines.
One of the most immediate benefits of real-time access to operational data is enhanced internal oversight and efficiency. For instance, in the Live Case Processing dashboard for UBC’s Tableau Data Analytics platform, pharmacovigilance teams get a dynamic overview of all cases within the workflow, which are visually flagged by their due dates. This allows teams to address cases based on their timelines far more efficiently than sifting through Excel spreadsheets. As a result, case processors can efficiently prioritize the review of cases approaching their review deadlines, ensuring timely completion and compliance.
Pharmacovigilance operational data also aids in strategic planning and resource alignment at a program level. By collecting retrospective data and understanding case sources and volumes, companies can accurately forecast future case volumes and align staffing accordingly, ensuring optimal operational capacity. In turn, adapting staffing to fluctuating case volumes helps avoid bottlenecks in case processing which could contribute to the mis-assessment or processing delay of adverse event cases – both of which are common causes of regulatory noncompliance.
Trend analysis informs quality control
Quality control – the assurance that safety data is processed accurately, completely and consistently – can also be improved with oversight into operational pharmacovigilance data. For instance, the quality control dashboard from UBCs Tableau Data Analytics platform allows for the analysis of quality control corrections at an individual case level. By analyzing quality control correction trends, quality control specialists are able to proactively identify specific areas of concern and develop long-term corrective and preventative actions to address those concerns, such as additional training or targeted adjustments to case processing activities. Later, the same quality control dashboard can be used to assess the effectiveness of corrective interventions.
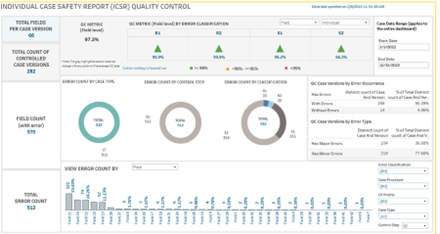
A quality control dashboard allows for the analysis of quality control corrections at an individual case level.
Intuitive visualizations expedite decision-making
An accurate understanding of the pharmacovigilance process by stakeholders who are external to pharmacovigilance activities, including regulatory auditors and organizational decision makers, is essential for effective oversight and compliance. These stakeholders often have specific questions about the pharmacovigilance process that can be quickly resolved with intuitive visualizations of relevant pharmacovigilance data.
Crucially, this communication is jeopardized when stakeholders cannot effectively access or understand data-based insights. Without the ability to generate real-time custom visualizations, these communications barriers remain high, limiting the ability to convey critical information from pharmacovigilance oversight data. Extensive time and expertise would be needed to manually extract, synthesize and visualize listings from a safety database. This manual analysis can delay data-based decision-making and encourage under-informed decisions by auditors and organizational decision makers.
In contrast, the generation of custom, high-quality data visualizations promote cross-team communication and informed decision-making. Take, for example, a meeting in which a pharmacovigilance expert and an organizational decision maker are both present. The decision maker wants to know whether a newly initiated program to solicit adverse event case reports from specialty pharmacies in China has been effective. With a real-time dashboard, the pharmacovigilance expert can pull up a graph of case reports by region, filter the data by source (“specialty pharmacy”), and share the visualization, all within the same meeting. This visualization immediately shows that the specialty pharmacy source has contributed a significant volume of adverse event cases, suggesting the program’s effectiveness. Without access to such dashboard visualizations, the process of extracting and synthesizing this data might take days or be de-prioritized against other pressing tasks.
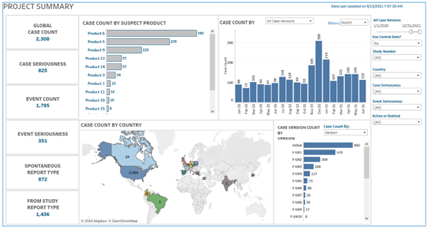
A real-time project summary dashboard displays case count by country.
Transparent data fosters trust between stakeholders
When diverse stakeholders – including pharmacovigilance staff, regulatory authorities and companies – all have access to operational pharmacovigilance data that they trust and understand, trust between stakeholders improves as well. Data transparency and accessibility is particularly invaluable during audits and inspections, providing clear proof of ongoing monitoring and improvement efforts that were previously reliant on the manual review of routing comments or action items in a safety database.
Companies working with pharmacovigilance service providers also benefit from oversight into their service providers’ performance, which allows them to audit the workload, health and performance of their pharmacovigilance program in real time. Moreover, operational data provides financial transparency between companies and pharmacovigilance service providers. Systems that collect operational pharmacovigilance data offer accurate, unmodified information for client invoicing, ensuring a precise representation of completed work without manual intervention.
By transforming disparate and often inaccessible operational data into intuitive, actionable dashboards and visualizations, real-time pharmacovigilance oversight ensures the regulatory compliance, resource efficiency, and enduring health of a pharmacovigilance program. This transformation marks a fundamental shift from a reactive, often manual, pharmacovigilance oversight process to a proactive, efficient, and highly transparent operation, fundamentally changing how decisions are made in pharmacovigilance.
To learn more about the capabilities of UBC’s Tableau Data Analytics in more detail, read our case study HERE.
Related reading:
Read our White Paper: Best practices for pharmacovigilance safety data management
Blog: Operational Data On-Demand: Overcoming Barriers to Effective Pharmacovigilance Oversight
About UBC
United BioSource LLC (UBC) is the leading provider of evidence development solutions with expertise in uniting evidence and access. UBC helps biopharma mitigate risk, address product hurdles, and demonstrate safety, efficacy, and value under real-world conditions. UBC leads the market in providing integrated, comprehensive clinical, safety, and commercialization services and is uniquely positioned to seamlessly integrate best-in-class services throughout the lifecycle of a product.
About the Authors

Poonam Pathak, Team Manager, Global Case Processing
Poonam Pathak has been part Poonam Pathak has been part of the pharmacovigilance (PV) field since 2014, demonstrating expertise in all facets of clinical trial and post-marketing for pharmaceutical products, tobacco products, vaccines, and medical devices. Her experience encompasses leading and participating in case processing activities, literature screening and review, data migration, as well as the preparation and development of aggregate reports.
As a Global Manager at UBC, Ms. Pathak oversees PV safety monitoring and risk management for a team of PV professionals (including safety scientists and safety data associates) to develop safety reporting and RMPs.

Erin Williamson, Associate Director, Global Case Processing
Erin Williamson serves as Associate Director, Global Case Processing. In this role, Erin is responsible for oversight and execution of global Pharmacovigilance (PV) case processing activities contracted by UBC’s clients. This includes responsibility for and oversight of deliverables which ensure regulatory compliance, data quality, and team productivity.
Erin has over 20 years of industry experience in clinical and drug safety at ICON, Wyeth, Pfizer and UBC. She has a broad pharmacovigilance experience for a wide range of drugs, biologics, vaccines and devices, both in clinical development and post-marketing, including case processing and submission activities, signal management activities and aggregate safety reports. Erin Williamson has a BS in Biology from LaSalle University.